Average Height for 7-Year-Old Girls
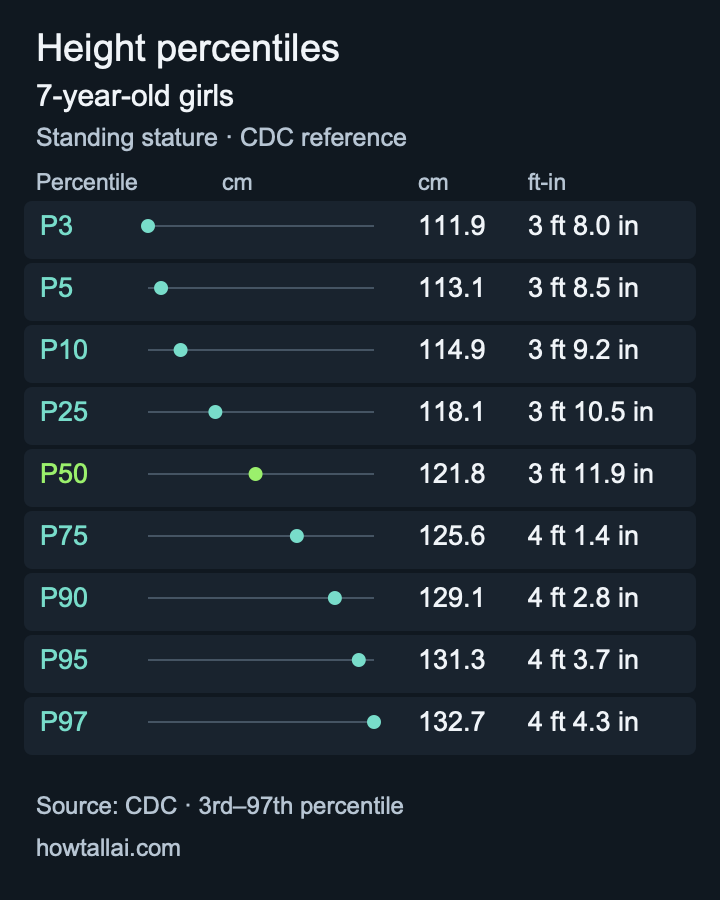
Selected standing stature percentiles for girls at 7 years, reported in centimeters and feet-inches from the cited official reference table.
The 50th percentile of height for 7-year-old girls is 121.8 cm (3 ft 11.9 in). In the same CDC reference row, the 3rd to 97th percentile range runs from 111.9 cm (3 ft 8.0 in) to 132.7 cm (4 ft 4.3 in).
CDC percentile table
| Percentile | Metric | Feet-inches |
|---|---|---|
| 3rd | 111.9 cm | 3 ft 8.0 in |
| 5th | 113.1 cm | 3 ft 8.5 in |
| 10th | 114.9 cm | 3 ft 9.2 in |
| 25th | 118.1 cm | 3 ft 10.5 in |
| 50th | 121.8 cm | 3 ft 11.9 in |
| 75th | 125.6 cm | 4 ft 1.4 in |
| 90th | 129.1 cm | 4 ft 2.8 in |
| 95th | 131.3 cm | 4 ft 3.7 in |
| 97th | 132.7 cm | 4 ft 4.3 in |
Where does a given height fall at this age?
Enter a height in centimetres, or in feet and inches, to see its percentile in the CDC reference table above for 7-year-old girls. The calculation runs in this page and sends nothing anywhere.
Enter a height between 101.9 cm and 146.6 cm.
Percentiles come from the CDC L, M and S parameters published on the same row as the table above (Sex=2, Agemos=84.5 (completed month 84 band)). A percentile is a position in that reference distribution for children of the same sex and age band; it is not a forecast, a diagnosis, or an assessment of any individual.
How common is a given height at this age?
Each row below converts a whole-step height to centimetres and places it against the nine percentiles published in the CDC table above. No value is interpolated: the comparison is read straight off that table.
Where does 3 ft 9 in fall for a 7-year-old girl?
3 ft 9 in is 114.3 cm. In the CDC table above, that falls between the 5th percentile (113.1 cm) and the 10th percentile (114.9 cm) for 7-year-old girls.
Where does 3 ft 10 in fall for a 7-year-old girl?
3 ft 10 in is 116.8 cm. In the CDC table above, that falls between the 10th percentile (114.9 cm) and the 25th percentile (118.1 cm) for 7-year-old girls.
Where does 3 ft 11 in fall for a 7-year-old girl?
3 ft 11 in is 119.4 cm. In the CDC table above, that falls between the 25th percentile (118.1 cm) and the 50th percentile (121.8 cm) for 7-year-old girls.
Where does 4 ft 0 in fall for a 7-year-old girl?
4 ft 0 in is 121.9 cm. In the CDC table above, that falls between the 50th percentile (121.8 cm) and the 75th percentile (125.6 cm) for 7-year-old girls.
Where does 4 ft 1 in fall for a 7-year-old girl?
4 ft 1 in is 124.5 cm. In the CDC table above, that falls between the 50th percentile (121.8 cm) and the 75th percentile (125.6 cm) for 7-year-old girls.
Where does 4 ft 2 in fall for a 7-year-old girl?
4 ft 2 in is 127.0 cm. In the CDC table above, that falls between the 75th percentile (125.6 cm) and the 90th percentile (129.1 cm) for 7-year-old girls.
Where does 4 ft 3 in fall for a 7-year-old girl?
4 ft 3 in is 129.5 cm. In the CDC table above, that falls between the 90th percentile (129.1 cm) and the 95th percentile (131.3 cm) for 7-year-old girls.
Where does 4 ft 4 in fall for a 7-year-old girl?
4 ft 4 in is 132.1 cm. In the CDC table above, that falls between the 95th percentile (131.3 cm) and the 97th percentile (132.7 cm) for 7-year-old girls.
What these numbers imply
The figures below are not published directly by the CDC. Each one is calculated from the official stature-for-age and weight-for-age tables so that this page answers questions the raw dataset leaves open. Values differ for every age and sex.
| Measure | Value | How it was derived |
|---|---|---|
| Growth over the next 12 months | +6.1 cm | The 50th percentile rises from 121.8 cm to 127.8 cm over the following year. Derived from adjacent rows of the same CDC table. |
| Spread between 3rd and 97th percentile | 20.9 cm | At this age the middle 94% of girls fall between 111.9 cm and 132.7 cm. A wider spread means age alone explains less. |
| Share of adult median height reached | 74.5% | The 50th percentile at this age is 121.8 cm; the CDC table ends at age 20 with a 50th percentile of 163.3 cm. |
| Difference from boys at the same age | -0.3 cm | The 50th percentile for girls is 0.3 cm shorter than the 50th percentile for boys at this age. |
| Median weight and resulting BMI at this age | 22.9 kg · BMI 15.4 | Combining the 50th percentile of weight (22.9 kg) with the 50th percentile of height (121.8 cm) from the CDC weight-for-age and stature-for-age tables. |
These are population reference statistics only. They describe how a group of children of this age and sex is distributed, and say nothing about any individual child.
How to read this table
For this table, the percentile is a position in the cited reference distribution for children of the same sex and completed age band. The 50th percentile is the median: about half of the reference observations are lower and half are higher. A percentile is not a forecast, target, diagnosis, or measure of an individual child’s health. Measurement method and the reference chart used can change the reported position.
Measurement: CDC reports standing stature for this age band.
Adjacent ages
Related charts
Height predictor
Looking for an estimate for one child rather than a reference table? Try the free height predictor on the homepage.
Data source
Dataset: CDC 2000 Growth Charts: stature-for-age, 2-20 years. All nine displayed values come from statage.csv, row Sex=2, Agemos=84.5 (completed month 84 band). See the official CDC dataset page.
Reference distribution only. This page does not provide medical advice, a diagnosis, or an individual height forecast.